MATLAB学习笔记(四) 基础绘图Basic Plotting structure and File access

1基础

1.1plot()

1
2
3
ploy(x,y)	plots each vector pairs (x,y)
plot(y) plots each vector pairs (x,y),where x=[1…n], n=length(y) 默认横轴为1.2.3.4...
plot(cos(0:pi/20:2*pi)); 第一个图!

一幅图中多个曲线:

1
2
3
4
5
6
7
8
9
10
11
12
13
14
15
hold on
plot(cos(0:pi/20:2*pi));
plot(sin(0:pi/20:2*pi));
hold off

也可以

x = 0:pi/100:2*pi;
y = sin(x);
y2 = sin(x-.25);
y3 = sin(x-.5);
plot(x,y,x,y2,x,y3)

标识
legend('sin(x)','sin(x-.25)','sin(x-.5)')

1.2plot style

1
plot(x,y,'str') 	plots each vector pairs (x,y) using the format defined in str (check linespec)

改变颜色、线条,也可以在绘图框:查看→绘图浏览器,手动更改!

1
2
3
4
5
6
x=0:0.5:4*pi;
y=sin(x); h=cos(x); w=1./(1+exp(-x));
g=(1/(2*pi*2)^0.5).*exp((-1.*(x-2*pi).^2)./(2*2^2));
plot(x,y,'bd-',x,h,'gp:',x,w,'ro-',x,g,'c^-');

legend('sin(x)','cos(x)','Sigmoid','Gauss function'); 加标识

1.3title() and label()

1
2
3
4
5
6
x = 0:0.1:2*pi; y1 = sin(x); y2 = exp(-x);
plot(x, y1, '--*', x, y2, ':o');
xlabel('t = 0 to 2\pi'); x轴标题,\为转义字符
ylabel('values of sin(t) and e^{-x}') y轴标题
title('Function Plots of sin(t) and e^{-x}'); 加图名
legend('sin(t)','e^{-x}'); 加图标

1.4text() and annotataion()

1
2
3
4
5
x = linspace(0,3); y = x.^2.*sin(x); plot(x,y);
line([2,2],[0,2^2*sin(2)]);
str = '$$ \int_{0}^{2} x^2\sin(x) dx $$'; latex语法
text(0.25,2.5,str,'Interpreter','latex'); 显示字符串的位置,解释器latex
annotation('arrow','X',[0.32,0.5],'Y',[0.6,0.4]); 箭头起终位置

1.5figure adjustment

属性检查器可以更改很多绘图对象!

2更多自定义

2.1设定边界

各种自定义,但用属性编辑器调整,更为直观!

2.2多图

figure命令,

1
2
3
4
5
x = -10:0.1:10;
y1 = x.^2 - 8;
y2 = exp(x);
figure, plot(x,y1);
figure, plot(x,y2);

Figure Position and Size 有点像css

1
figure('Position', [left, bottom, width, height]);

多图合一:

1
subplot(m, n,1);

1
2
3
4
5
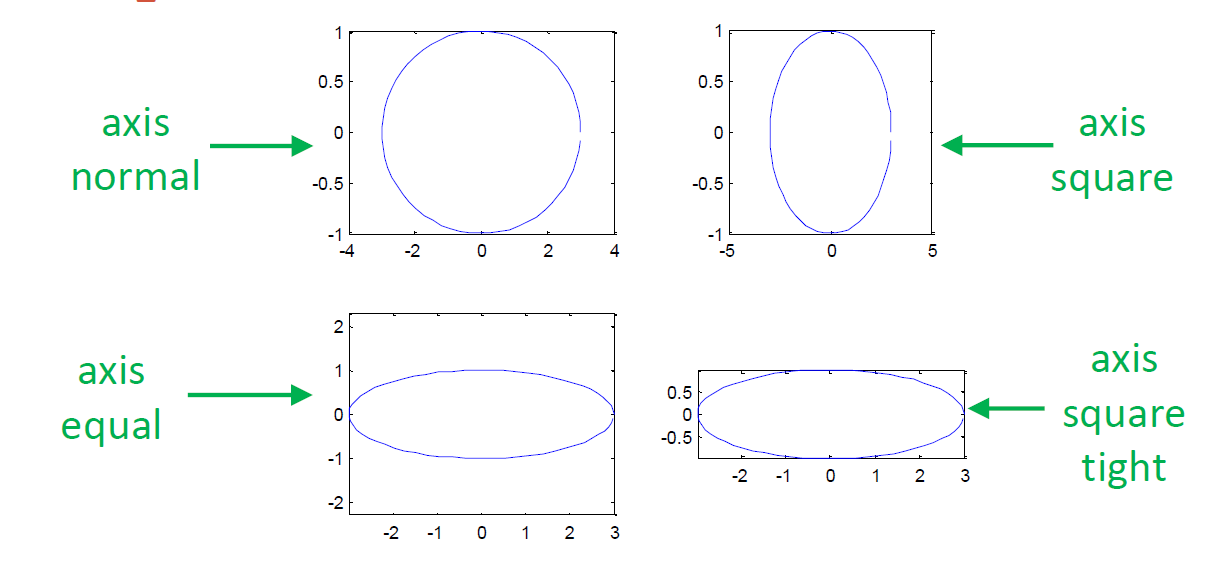
t = 0:0.1:2*pi; x = 3*cos(t); y = sin(t);
subplot(2, 2, 1); plot(x, y); axis normal
subplot(2, 2, 2); plot(x, y); axis square
subplot(2, 2, 3); plot(x, y); axis equal
subplot(2, 2, 4); plot(x, y); axis equal tight

2.3一些功能

1
2
3
4
5
6
7
8
9
10
11
12
13
grid on/off 		Make the grid visible or invisible
box on/off Make the box visible or invisible
axis on/off Make the axes visible or invisible
axis normal Automatically adjust the aspect ratio of the axes
and the relative scaling of the data units
axis square Make the current axes region square
axis equal Set the aspect ratio so that the data units are the
same in every direction
axis equal tight Set the axis limits to the range of the data
axis image Let the plot box fits tightly around the data
axis ij Place the origin of the coordinate system in the
upper left corner
axis xy Place the origin in the lower left corner

2.4保存

print 输出高解析度图片!


MATLAB学习笔记(四) 基础绘图Basic Plotting structure and File access
https://yuzhang.net/2020/08/01/MATLAB学习笔记(四) 基础绘图/
作者
Yu Zhang
发布于
2020年8月1日
许可协议